Methodology version: v0.5
How an Akkubrief is made — our methodology
Updated:
No provider in this market spells out how its calculation works. We do, because a certificate is only worth as much as the traceability behind it. This page is versioned; whatever changes is recorded in the changelog below. Critical scrutiny is explicitly welcome.
1. How the data reaches us
You connect your Tesla account through the official Fleet API — with read-only permissions. We cannot control, open or change anything. And one rule is hard-coded on our side: we never wake your car. No sneaky wake-ups for readings, no phantom drain caused by us; if the vehicle sleeps, we wait.
Raw data reaches us two ways. The preferred one is Fleet Telemetry: the vehicle streams its own values, including measured remaining energy in kilowatt-hours. Where that channel is running we calculate from it alone. Where it is not available we fall back to periodic status reads of the Fleet API — only ever while the vehicle is awake anyway.
The two channels are not equivalent. Over a status read Tesla's API returns no measured kilowatt-hours, but the vehicle's range estimate, which we convert — so the value depends on the vehicle's own calibration. We measured how large the gap is on our own car: the converted figure sat about 7 percent above the streamed one. That is why we never mix the two sources in one calculation; we take the stronger one that carries the result on its own, and every certificate states which it was.
On top of that we record the energy added during charging for each charging session. Once enough usable charging sessions exist, that becomes the headline figure — it is the only quantity in the chain the vehicle does not estimate itself.
2. How we calculate
Tesla's API does not provide a ready-made SoH figure. But every charging session reveals capacity:
capacity ≈ energy added (kWh) / (Δ state of charge / 100)
Charge from 20 to 80 percent while adding 45 kWh, and your battery holds roughly 75 kWh of usable capacity.
What matters is that this is a difference, not a ratio. The reason is a detail we measured on our own vehicle: below the displayed zero sits a buffer of roughly 3 kWh that the car never releases. Calculate "remaining energy divided by state of charge" instead, and that buffer counts as usable capacity — the more so the emptier the battery. At 30 percent charge it adds 10 kWh too many, at 100 percent only 3. We found exactly that dependence on state of charge in our data: 7.5 kWh of difference across the charge range, purely from how the sum is written. In a difference the buffer cancels out. So we only ever work with differences.
The unit of our measurement is the measurement run: one continuous drive or charge during which the state of charge moves in a single direction. A thousand readings during one charging session are one measurement, not a thousand. A car sitting in the garage for a week collects no measurement runs — and its certificate quality does not improve either.
Many measurement runs then become one value. A single estimate is noisy — temperature, charging losses and measurement resolution all scatter — so we calculate robustly: a Theil–Sen estimator rather than a regression, medians rather than means, so that individual outliers cannot tip the result.
From a straight line to a characteristic curve
One charging session does not measure the battery, it measures a stretch of it: the energy between two states of charge. Charge from 20 to 60 percent and you know what those forty points are worth, and nothing about the last five before the displayed zero.
Our earlier calculation nevertheless turned that stretch into a statement about the whole axis: the slope from the middle, times a hundred. That holds as long as a battery yields the same energy per percentage point across the entire charge range — and it does not. In the full-swing telemetry of our own vehicle both edges are measurably flatter than the middle: roughly 0.44 against 0.52 to 0.58 kilowatt-hours per percentage point. A straight line through the middle, projected across the full range, therefore counts energy the car does not release at the edges. On our test vehicle that came to 1.3 to 2.7 kilowatt-hours too much.
Since method version cert-3.0.0 we calculate the other way round. From every
interval that charging sessions and drives provide, we estimate the
characteristic curve: how many kilowatt-hours sit in each part of the charge
range. The headline figure is then no longer a projected slope but the area
under that curve — the energy between a displayed 0 and 100 percent. Where we
measured, the measurement counts.
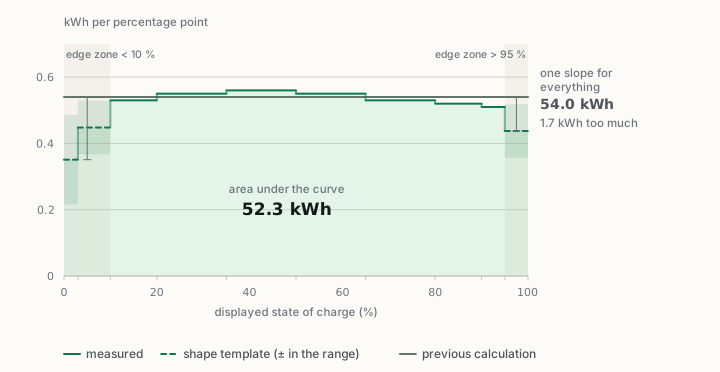
Where a section stays unmeasured (most cars never go below 10 percent), no extrapolation fills the gap. A shape template does: the typical shape of that edge, held per data-channel manufacturer and cell chemistry. It is stored deliberately as a relative shape rather than a kilowatt-hour figure; in effect it says: up here it is typically 0.8 times the middle. The level always comes from the vehicle itself — a certificate never inherits the state of health of other cars.
Two rules come with that. A vehicle's own measurement takes precedence: once a car has driven through an edge section itself, its measurement applies, and applies for good. A single drive from above 90 to below 15 percent sharpens the statement measurably. And the uncertainty of the template sits in the range, not in the value: using little of the charge range does not earn you a worse figure, it earns you a wider one.
Since cert-3.1.0 a third rule applies in the edge zones: there, the
discharge side counts. The certificate states extractable energy, and at
the edges in particular, charging and discharging read measurably
differently. An edge section therefore counts as measured only once
discharging runs cover it — charging alone leaves the template in place.
Where both directions cover the same section, their measured difference
additionally enters the uncertainty range.
How much difference this makes depends on exactly that. For a car that uses the charge range widely anyway, almost nothing changes: where there is no unmeasured edge zone, there is nothing to project. The difference arises where the earlier calculation was guessing.
Because the change moves the headline figure, every certificate since then carries both quantities: the curve figure up front, together with a note on which part of the charge range was measured, and below it the earlier calculation as a comparison line. A document issued today therefore stays comparable with one from yesterday, and the difference can be read rather than passed over.
Decline is signal, not noise
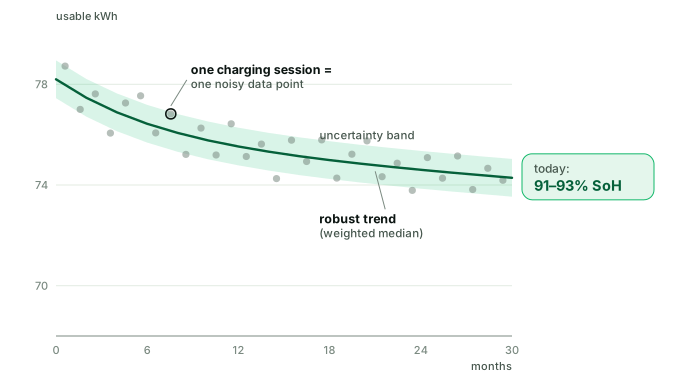
A measurement run from a year ago measures the battery as it was a year ago — and it was better then. Averaging every measurement into one figure would therefore blend past with present: the value published would be an average across months rather than today's figure.
So we fit a straight line through the history — over time and over distance travelled — and publish the value at the current end of that line. The decline itself becomes a statement in its own right: how much capacity is lost per year and per 10,000 km. What remains once the line is subtracted is genuine measurement scatter, and only that enters the uncertainty range.
One rule matters to us here. If the calculation says the battery has become better, we do not discard that. It cannot happen physically, and it suggests the vehicle system has recalibrated — so it widens the uncertainty range instead of quietly disappearing. A jump like that is our best warning sign; hiding it would be the opposite of methodology.
The uncertainty range
The result is deliberately a range — say "91 to 93 percent" — instead of pseudo-precise decimals. That range is a sum of named influences: the scatter between measurement runs, the part of the charge range we never see, the difference between charging and driving, the resolution of the vehicle data, the gap since the last measurement, and contradictions in the trend. Every certificate lists them individually.
That has a consequence we care about: the range does not converge to zero. Only one item falls over time, the scatter between measurement runs; measuring forever therefore does not buy an arbitrarily sharp figure, it lands you on a floor. Most of that floor is usually the unmeasured edge of the charge range: not every car sees the top 5 and bottom 10 percent, and where it does not, the shape template stands there with its own uncertainty. Conversely, the largest single item tells you what would actually sharpen the statement: for most vehicles that is not waiting, but making fuller use of the charge range.
If the data is not sufficient, we issue no certificate. Better no number than a shaky one.
When we issue
Behind "no certificate without sufficient data" sits a technical gate with four criteria — only once all of them are met can an Akkubrief be created:
- Enough usable readings (at least 10): points with a sufficient state of charge and a plausible capacity — unusable ones are discarded and do not count.
- Enough measurement runs (at least 3): continuous drives or charging sessions with a sufficient swing in state of charge. Many readings at an identical state of charge are one measurement in copies — a car that is merely connected and never moved produces no measurement run at all and will therefore never become "ready".
- Minimum time span (5 days): several independent driving and charging days instead of a single day's form (say, a BMS right after a calibration charge, or one hot fast-charging day).
- Confidence: the uncertainty range of the estimate must be tight enough (±2.0 percentage points) — quality decides, not the calendar. If you drive a lot and make use of the charge range, you are often there after about a week; if you always charge within the same narrow window, it takes longer. The threshold applies to the measurement precision of the individual vehicle. The comparison with the as-new state additionally carries the uncertainty of the variant's as-new reference and is therefore wider; the certificate labels both parts separately.
The thresholds are deliberately public and will be calibrated as the fleet grows; changes appear in the log below.
3. From percent to kilometres
The percentage answers the question about condition. The question in a classified ad is a different one: how far does the car still go? Both have the same answer in different units, and the certificate converts between them:
range on a WLTP basis = this vehicle's WLTP range when new × (usable energy today ÷ usable energy when new)
The second factor is the headline figure. The first is an official figure, not an estimate: it either comes from this vehicle's certificate of conformity, or it is the value for precisely this specification from open EU vehicle registers. Where it is missing, the figure is omitted. An average across the variant is out of the question: under a single variant code the registers hold up to four official ranges as much as 19 percent apart, which is more than our measurement provides in signal.
WLTP consumption does not appear in the calculation. It sits inside the as-new range and cancels against itself. Until 2 September 2026 the certificate instead carried a range derived from one consumption value used for every vehicle; that figure has gone, with nothing put in its place.
What the conversion does not improve: accuracy. It is a linear conversion of the same measurement, so it is exactly as accurate as the percentage. The uncertainty band is converted along with it and stands beside the figure in kilometres.
One assumption, named openly: the conversion assumes that consumption per kilometre does not change as the vehicle ages. Our field data cannot test this. Where it does not hold — because a rising internal resistance produces more losses, say — the real range falls somewhat short of the figure stated.
And what WLTP is: a standardised test cycle. In the cold, at speed or when towing you will get less, in a new car as much as in a used one. The figure compares with the rating stated on every new car, and it is not a forecast for everyday driving.
4. What a history shows and a snapshot cannot
A test on a single day measures exactly that: one day — with its temperature, state of charge and measurement errors. A history across weeks and months separates these effects from one another: what changes randomly averages out; what falls steadily is ageing — and that becomes a statement in its own right rather than noise. It is exactly what buyers care about: how this battery ages, not just where it stands today. Jumps caused by BMS drift are obvious in a history; in a snapshot they look like truth.
5. Limits — and what an Akkubrief is not
Every figure is an estimate with a stated uncertainty, not a lab measurement. And every figure comes from its measurement period: seasonal temperature effects can shift usable capacity by a few percent — no short test can or should wait for another season, which is why every certificate openly states the period it was measured in. The Akkubrief is not an official government document and not an inspection by a testing organisation, and it does not warrant the vehicle. Our calibration against reference measurements is in progress: a validation study with a community fleet is the next step — the published error metrics will be linked here once available.
6. Scientific basis & standards
Our approach does not stand in a vacuum. Since 2022, UN Regulation GTR 22 has provided, for the first time, a globally agreed standard for how to measure the ageing of a traction battery. It defines the metric State of Certified Energy (SoCE): the currently usable battery energy relative to the energy certified at registration — energy-based and determined under defined conditions. The EU adopts these requirements in Euro 7 (Regulation (EU) 2024/1257); future new vehicles must make SoCE accessible themselves and are required to retain at least 80 percent after 100,000 km and at least 72 percent after 160,000 km.
We compute precisely this physical quantity — the usable energy — only from real charging history rather than a single test cycle. That SoCE can be measured in practice was shown experimentally on an aged vehicle by the EU Commission's Joint Research Centre and published. That many real data points are more reliable than a single measurement is further supported by large-fleet and modelling work (such as NREL BLAST). This is the scientific basis our calculation rests on.
GTR 22, however, describes a certified on-board monitor in a new car plus a manufacturer test procedure. The Akkubrief is not such an on-board monitor and does not claim to be the standardised test procedure — we align with the concept of the standard and estimate the same quantity independently and traceably for vehicles that have no on-board monitor.
The same distinction applies to the range on a WLTP basis in section 3. Besides SoCE, GTR 22 also defines State of Certified Range (SoCR), a separate regulatory quantity with its own test procedure. Our conversion is not SoCR and is not called that: the range ratio follows from an energy ratio only for as long as consumption per kilometre stays the same, which is the assumption section 3 names. We align with the underlying idea of range retention, and the certificate claims nothing more at this point.
Evidence from independent research
Our approach is in line with the state of the research literature. The key evidence, deliberately stated with restraint:
- Accuracy from real charging data. Studies that estimate condition from real charging segments reach errors of around two percent against measured reference capacity (Scientific Reports 2025) — the same order of magnitude as hardware tests.
- Our capacity formula. "Usable energy per charge step" is established in research as the Integrated-Voltage / Incremental-Energy-per-SoC method (Jenu et al. 2022; Guo et al. 2024).
- Robust statistics. Median/MAD-based, outlier-resistant methods such as the Theil–Sen estimator are the accepted way to extract trends from noisy real-world battery data.
- Why the trajectory matters. A single, uncontrolled measurement carries several percent of uncertainty (Barai et al. 2019), and because ageing is path-dependent, a single value says little about the further trajectory (Rogge et al. 2024).
These figures come from methods research, not from a measurement of our own service. We will report our own error metric once the announced validation study is available.
7. Tamper-proof by signature
Every certificate is signed with Ed25519. The certificate ID is the hash of the signed content — ID, statements and signature are inseparable, and any subsequent change fails verification. The verification page runs entirely in your browser (WebCrypto): check the signature, recompute the certificate ID, optionally match the VIN — which, for privacy, appears only masked and as a SHA-256 hash inside the certificate.
8. Version & changelog
The current methodology version is shown at the top of this page; every certificate references the version it was calculated with. The most recent changes:
- 2 September 2026 — Alongside the percentage the certificate states a
range in kilometres — this vehicle's own, not the variant's
(
cert-2.5.0/cert-3.3.0). - 27 August 2026 — The headline figure comes from the characteristic
curve rather than a projected slope (
cert-3.0.0); in its edge zones the discharge side counts (cert-3.1.0), and both quantities appear in the certificate. - 20 August 2026 — v0.4 + v0.5: capacity is a slope, the measurement run is the unit, and decline is calculated rather than averaged away.
- 16 August 2026 — v0.2 + v0.3: measurement window instead of discarding, weighted span, one energy source per calculation, confidence from independent measurement days.
- 9 August 2026 — Provenance marker for the measured energy.